« Zurück zu Community Portlets
Google Chartlet
Note: This page describes a portlet developed by the community that is not an official part of Liferay Portal
Google Chart Portlet or Google Chartlet is a portlet which shows you how to use Google Charts in a portlet.
This portlet uses Charts4j api to generate Google Charts.
This portlet can be configured to display four charts that makes use of Liferay data to generate Google Charts. Besides it has some sample charts that gives you an idea on types of charts that can be made using the charts4j api.
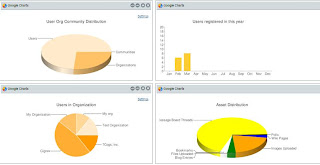
Liferay Charts
- Shows total users, organizations and communities in the system (2D and 3D pie charts)
- Shows number of users in the organization (2D and 3D Pie chart)
- Shows number of users registered with system for current year(Bar chart)
- Shows distribution of assets in system(2D and 3D pie charts)
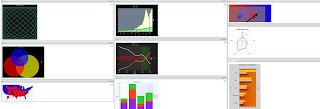
Sample Charts
- These are basically the same charts that are listed in charts4j project page. They are static charts, but show the power of Google charts and Charts4j api.
How to Configure?
- This portlet basically is an instanceable portlet. So you can create multiple instances of portlet on same page.
- Configuring is pretty much simple. You will see Configure button as soon as you add the portlet.
- Clicking on that you are provided with two step process of selecting the type of report and type of chart.
- Once you have done that you will be shown the chart.
- You can click on settings if you have configure permission, where you can set the report title, width and height of report.
Screenshots
Links
32539 Angesehen
